
I will freely admit that I am an avid online shopper. At the forefront of marrying fashion with technology is Nordstrom. My mother and I have been fans for years. We’ve always been amazed by how they manage to solve and even preempt consumer issues. They are proactive, sleek, and smart.
Recently, while browsing their Anniversary Sale, I noticed the almost deliberate diversity of their Women’s Clothing models (‘what is this, a college admissions catalog?’). The first three women on the landing page were all Asian. As an Asian woman myself, I was intrigued to see this. I continued to scroll down and saw glowing African American models as well as the to-be-expected sultry brunettes and ethereal blondes.
It was around page 3 that my liberal education took over. How are they choosing which models to represent which styles? Is there logic or reasoning to it, or is it simply random? Why wonder — I had an entire Sunday and coffee brewing. Let’s do this.
I picked up a few patterns quickly. First, the diversity was definitely deliberate. There was a consistent mix of races on each page. Here’s how the Nordstrom models stacked up against the general US population:

Pretty close, too close to be random.
Next, I noticed that some models were regulars for certain brands (e.g. Topshop almost always uses a blonde model). There must be some reasoning behind the matches. Instead of letting this hunch fester, I went ahead and got the data. I took note of the following data points:


- Brand and item name
- Sale and full price
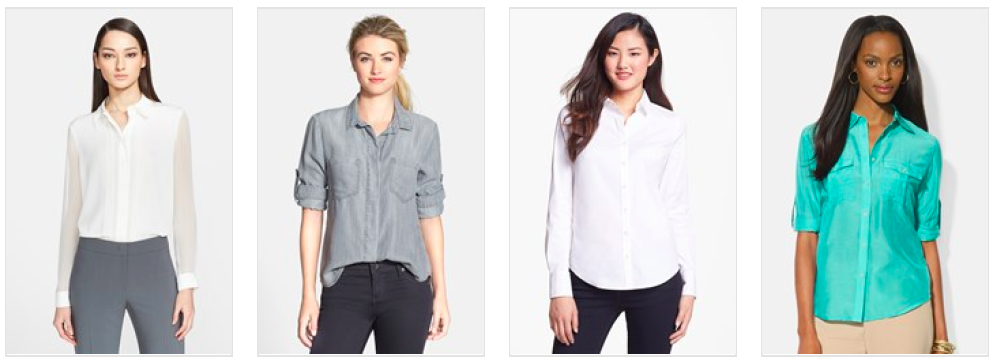
- Model’s most obvious race or hair color (please forgive me for the profiling—ignorance for knowledge)
- Product category
- Number of reviews
- Average customer rating
Fast forward about 300 entries later (gotta get that n), and I had my data. I removed Juniors items from the data set once I realized that they were all modeled by one girl and of a reliably lower price level. These were the initial results:

I was shocked by how much lower the average price of black models’ items were compared to the other groups. Conversely, the Asian models’ items were clearly more expensive. After taking a sociology class last semester on social metrics, I knew these averages were likely related to demographic income levels. I dug them up:

So, Nordstrom is almost creepily accurate in marketing in line with the nation’s income levels. Before jumping to any more conclusions, I added a few controls. The first approach: price buckets. Would the trends would persist under conditions with limited price variance? The initial results:


Notice how the number of black models’ items drops to 2 past $200. What’s also interesting to notice here is the Average Customer Rating (ACR). In Table F in particular, you’ll notice that the ACR for the Black group is clearly lower than the rest. I, probably like you are now, assumed that it was probably due to more expensive (and likely higher quality) items getting better reviews than cheaper items. A quick investigation revealed that this wasn’t the case at all.

The correlations are close to 0, or if present, negative!
So the trends persisted among higher end items. My second attempt at introducing some controls: product categories. Similar products should help remove some of the products’ effects on price differences. If black models were more likely to model Active wear ($30 running shorts and tanks, for example), this control would remove those differences. The results:


If anything, the product categories reveal starker differences between the groups. In every category, black models are the face of lower priced items.
Finally, I took the data as far as it could go. I ran two-sided t-tests based on the null hypothesis that each group’s averages equaled the total averages. The results:

(I realize that I did not run the tests on all of the control designs. If you would like to see those results as well (mainly other price buckets), please comment and I will gladly update this post.)
The results in green represent more favorable results compared to the average (i.e. on the right side of the bell curve). The results in red represent the other end of the spectrum. Interestingly, blonde models’ items are rated more favorably than the total group at a significance level of 95% in two designs. Meanwhile, brunettes are more likely to model more expensive dresses, while Asian models are more likely to wear less expensive tops. Black models are more likely to represent less expensive coats and dresses at significance levels over 99%.
These pricing patterns defy simple explanation. Without understanding the decision process on the retailer’s end, I cannot say what — if it is even a conscious decision — is motivating these patterns. Are retailers matching products to their customers’ tastes and incomes? Are the retailers biased? Are their brands biased? And is there a strategy at play here? Perhaps this is yet another glimpse of our society’s age-old biases found in one of our most modern and progressive spaces. The fitting room mirror isn’t always so flattering after all.
